-1.svg)
Behind every sale is a customer. See how they shop, return, and engage with loyalty across every site.
🏷️ The Customer dashboard is available on all Marsello plans.
This guide provides an overview of key business, loyalty, and customer metrics, along with suggestions to help you learn from your data, interpret it effectively, and refine your strategies to take meaningful actions aligned with your business goals.
📝 Note: This article is designed for easy navigation using the contents bar →
Customer dashboard overview
Confidently understand customer behavior, optimize customer loyalty efforts, and drive measurable business growth from a single, easy-to-use dashboard.
This customer dashboard does just that! It consolidates data from your Point-of-Sale and eCommerce platforms into a unified dashboard, providing you with a complete view of your business. You can then dive deeper into customer behavior metrics, filter by specific sites, and update the timeframe for more targeted insights.
The Customer dashboard is made up of three key sections:
- Business and loyalty metrics
- Customer snapshot
- Timeline
Here’s what makes the Customer dashboard so powerful
- View your performance across your entire business in one, unified dashboard 👀
- Understand and track the key business and loyalty metrics that drive customer engagement and impact sales 📊
- Use these insights to build and refine data-driven marketing strategies that achieve your business goals 🔎
- Free up more time to focus on growing your business by eliminating the need to compare data across platforms ⏱️
Key things to note
- Term update: 'Member' to 'Customer'. You'll see Customer used consistently within your Marsello admin. A customer refers to anyone listed in your Marsello database with a mobile number or email address. Customers are known individuals for whom you’ve begun collecting contact details, demographic and purchase data.
- Order timestamps: Orders' date timestamps are currently being calculated based on UTC timezone.
- Currency: Currency is displayed in your local currency with '$' displaying as a monetary symbol.
Business and loyalty metrics
Monitoring your business and loyalty metrics allows you to understand customer behavior, identify growth opportunities, and refine your strategies, helping you make informed decisions that drive profitability and long-term success.
Sales
-
Total sales: (Previously known as ‘Total revenue’.)
-
Represents the total business sales for the selected timeframe and site(s), calculated using orders synced from your Point-of-Sale and eCommerce integrations.
-

📝 Note: Your total sales also includes:
| Tax |
|
| Shipping |
|
| Discounts |
|
| Refunds/returns |
|
| Cancelled/void: |
|
Total sales breakdown
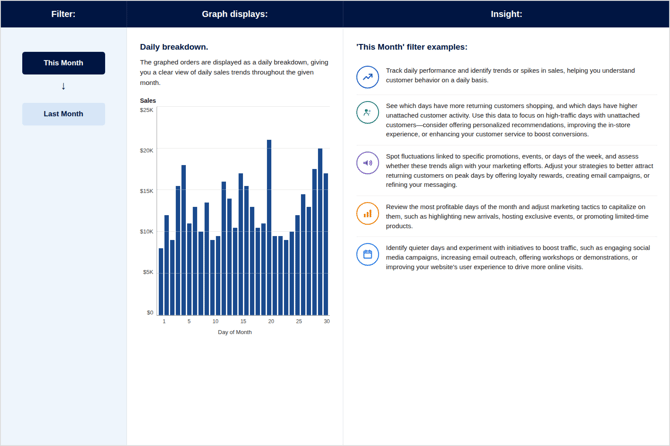
Represents how your total sales are distributed among returning customers, one-time customers, and unattached customers.

- Why it’s important: Understanding where your sales come from is key to driving sustainable growth. Sales from attached customers are repeatable because you can re-engage them with targeted marketing and loyalty initiatives. In comparison, sales from unattached customers aren't repeatable, as you are unable to contact and build relationships with them. By converting unattached sales into returning customers, you can create more predictable and consistent sales streams.
- Sales from:
-
Returning customers:
Sales from customers who have ordered before, counted when their repeat order falls within the selected date range. Only includes orders placed after you connected Marsello. (Previously known as ‘Returning members') -
One-time customers:
Sales from customers whose only order falls within the selected date range. Only includes orders placed after you connected Marsello. (Previously known as 'One-time members') -
Unattached customers:
Sales where no customer was linked to the order. (Previously known as 'Unknown members')
-
🎓 Key insights you can gain from these sales breakdown metrics:

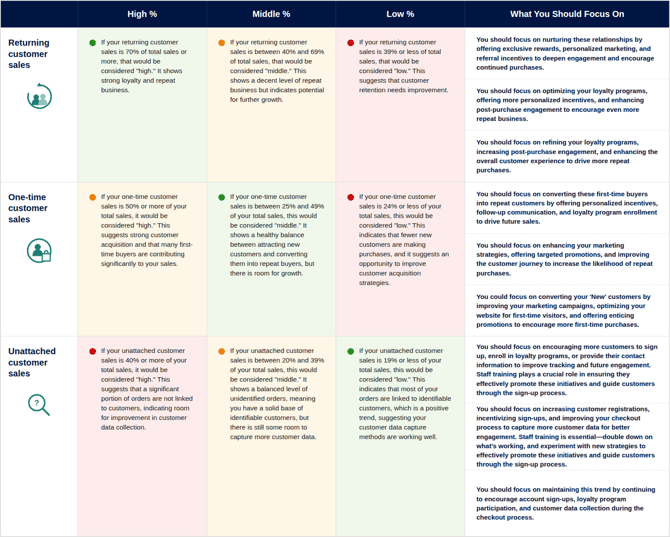
Graphed Sales
View the total sales for the specified timeframe and site(s), broken down by returning customers, one-time customers, and unattached customers.

🎓 Key insights you can gain from these sales breakdown metrics:
Compare how much of your sales come from returning customers, one-time customers, and unattached customers.
Returning customer rate
This represents the percentage of customers who purchased before the selected date range and purchased again during it, for the specified site(s).
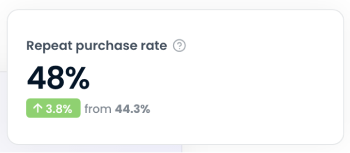
- Calculation: (Number of customers who ordered in the date range AND had also ordered before the date range ÷ Number of customers who ordered in the date range) × 100 (excludes sales where no customer was attached to the order.)
- Comparison: The % change shown at the bottom left corner represents a comparison with the previous period based on the selected time period.
- Why it's important: It helps you measure customer retention by tracking how often existing customers return to make additional purchases.
🎓 Key insights you can gain from returning customer rate
- A high returning customer rate suggests that customers are coming back to make additional purchases, which is a positive sign for a business's long-term growth.
- A low returning customer rate suggests that only a smaller percentage of customers are returning to make additional purchases, which indicates low customer loyalty. The retailer needs to improve customer engagement, satisfaction, and retention strategies.
🤖 Key industry statistic: A 5% increase in customer retention results in a profit increase of 25% to 95%.
Key loyalty metrics
Order value per customer
(Previously known as ‘Average member order value’.)
📝Note: Order value per customer averages each purchasing customer's own average order value. Order value (Business Performance) averages across all orders directly, including unattached customers.
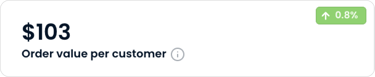
- Definition: The average amount each customer spent per order.
- Calculation: The average of each purchasing customer's average order value (excludes sales where no customer was attached to the order.)
- Comparison: The % change shown in the top-right corner represents a comparison with the previous period based on the selected time period.
- Why it's important: Order value per customer provides valuable insights into how much customers typically spend per transaction, enabling you to understand purchasing behavior. Use this metric to identify opportunities to increase spend per order, such as upselling, cross-selling, or enhancing loyalty program incentives.
Orders per customer
(Previously known as ‘Average orders per member’.)
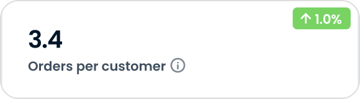
- Definition: The average number of orders placed per customer.
- Calculation: Total number of orders ÷ Total number of purchasing customers (excludes sales where no customer was attached to the order.)
- Comparison: The % change shown in the top-right corner represents a comparison with the previous period based on the selected time period.
- Why it's important: Orders per customer provides insights into the purchasing frequency of your customers, helping you evaluate engagement and loyalty. Use this data to identify trends in repeat purchases and consider strategies such as loyalty rewards, personalized marketing, or VIP offerings to encourage more frequent orders.
Spend per customer
(Previously known as ‘Average spend per member’.)
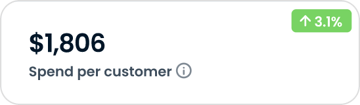
- Definition: The average each customer has spent during the selected date range.
- Calculation: Total spend ÷ Total number of purchasing customers (excludes sales where no customer was attached to the order.)
- Comparison: The % change shown in the top-right corner represents a comparison with the previous period based on the selected time period.
- Why it's important: Spend per customer provides insight into the overall spending habits of your customers, helping you gauge customer value and identify high-value segments. Use this information to tailor promotions, loyalty rewards, and personalized experiences to maximize customer engagement and increase overall spend.
Orders by new customers
(Previously known as ‘New members from orders’.)

- Definition: The number of orders placed by customers who are new to your database.
- Calculation: Total number of orders with a customer attached who didn't previously exist in your Marsello account.
- Comparison: The % change shown in the top-right corner represents a comparison with the previous period based on the selected time period.
- Why it's important: This metric tracks how effectively your business converts new customers into returning customers at the time of purchase. A high number indicates successful engagement and sign-up processes. Use this data to refine your onboarding strategies, optimize opt-in touchpoints, and encourage customer sign-ups during the checkout process.
Customer attachment rate
(Previously known as ‘Members attached to orders’.)

- Definition: The percentage of orders where a customer was attached to the sale.
- Calculation: (Number of orders with an attached customer ÷ Total number of orders) × 100
- Comparison: The % change shown in the top-right corner represents a comparison with the previous period based on the selected time period.
- Why it's important: This metric shows the proportion of orders coming from customers, helping you assess the strength of customer loyalty and engagement with your brand. A higher percentage indicates a strong customer base, while a lower percentage may suggest opportunities to enhance customer sign-ups or increase customer-driven purchases. Use this data to optimize loyalty programs and target strategies to increase customer attachment across more orders.
Positive feedback rate
(Previously known as ‘Happy members’.)

- Definition: The percentage of customers who have expressed positive sentiment following their purchase experience, through Feedback, within the specified timeframe and site(s). Customers may submit more than one response.
- Connected to: Feedback
- Calculation: (Number of Positive Feedback Responses ÷ Total Number of Feedback Responses) × 100
- Comparison: The % change shown in the top-right corner represents a comparison with the previous period based on the selected time period.
- Why it's important: This metric reflects the satisfaction level of your customers, providing insight into the overall customer experience. A higher percentage indicates strong customer satisfaction, that is crucial for retention and repeat business. Use this data to identify areas of success in your customer experience and find opportunities for improvement where sentiment may be lower.
🎓 Key insights you can gain from these loyalty metrics
Customer Snapshot
Previously known as ‘Members snapshot’.
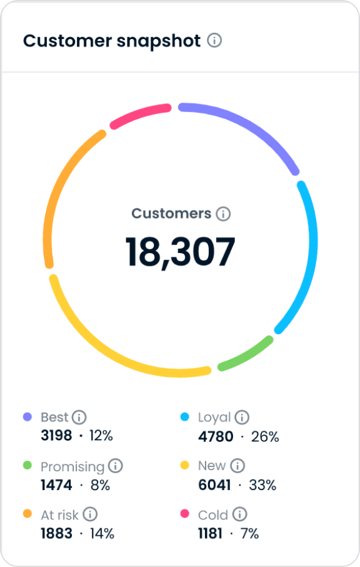
Your Customer Snapshot provides a breakdown of your customers by how recently, how often, and how much they've bought. Customers move between segments automatically as their ordering behavior changes.
This analysis is powered by RFM (Recency, Frequency, Monetary) analysis.

📖 What is RFM Analysis?
RFM is a marketing technique used to analyze and segment customers based on three key factors:
- Recency (R): How recently a customer has made a purchase. Customers who have purchased recently are more likely to engage again than those who haven't purchased in a while.
- Frequency (F): How often a customer makes a purchase. Frequent buyers are typically more loyal and valuable to your business.
- Monetary (M): How much money a customer spends. Customers who spend more are typically more valuable to your business.
RFM analysis is a widely used and highly effective technique, especially in fields like retail, e-commerce, and direct marketing. Businesses leverage RFM analysis to enhance customer segmentation and personalize their marketing efforts. It’s popular because it provides clear, actionable insights into customer behavior, enabling companies to optimize their marketing strategies, improve customer retention, and boost sales.
📖 Learn more: Introduction to customer segmentation using RFM Analysis.
Segments
Using RFM, customers can be organized into segments. These segments range from 'Best' customers (very loyal and huge fans of your store) to 'Cold' customers (may need reminders to shop with you again).
How segments are created and calculated:
Initially: When you connect Marsello to your eCommerce or POS site(s), your customer database and order history (last purchase date, total spend, number of orders) sync into Marsello and distribute customers across the seven RFM segments appearing on your dashboard.
Historical customer and order sync is available for the following integrations:
- Shopify; Shopify POS, eCommerce and Plus
- Lightspeed: X-Series, R-Series, O-Series, C-Series
- Cin7
- Heartland
- WooCommerce
Historical customer and order sync is not available for the following integrations:
- Lightspeed K-Series, E-Series
- Bopple (Lightspeed Ordering)
- BigCommerce
📝 Note: Historical sync can take 1-2 days depending on the quantity of data syncing.
Going forward: All segments are recalculated daily, and each customer is re-categorized after every purchase to ensure the segments accurately reflect their most recent shopping behavior.
RFM customer segment definitions:
- Best
Your most valuable customers who rank in the top 20% for both spend and order frequency. They've purchased recently and their days between orders is no more than double the average customer.
- Loyal
- Promising
- New
Recent customers who are new to your brand. They have completed one recent purchase or have low spend and order count so far.
- Potential (Previously Window Shoppers)
Customers who have provided an email or mobile number but have never made a purchase.
- At risk
- Cold (Previously Lost)
📝 Note: These segments are mutually exclusive, meaning that each customer can only be in one segment at one time.
Marketing subscribers (previously Chosen marketing channel(s)):
This displays the distribution of customers who have opted-in to receive marketing from your business, highlighting their preferred communication channels.
- Email only: These customers only accept email marketing from your store.
- SMS only: These customers only accept SMS marketing from your store.
- Email & SMS: These customers accept both email and SMS marketing from your store.
🎓 Key insights you can gain from marketing subscribers:
Knowing your customers' preferred communication channels is essential for optimizing engagement, personalizing interactions, and ensuring your marketing efforts are both effective and customer-focused. For example:
- SMS only, Email & SMS: Have you considered using SMS as a marketing channel?
- Reviewing the number of customers who have opted-in to SMS marketing can give you the confidence to experiment with this channel.
- Or if SMS isn't part of your strategy yet, it's worth revisiting your marketing opt-in process to grow your SMS opt-in customer base. This will ensure that, when you're ready to implement SMS marketing, you have a solid foundation for success.
RFM customer segments & marketing subscribers:
Click into each Segment to see more information about each RFM segment.
For each segment you'll see the follow details:
- RFM segment name
- RFM segment description
- Order value per customer: The average amount spent per order by a customer for the specified RFM segment
- Orders per customer: The average number of orders made by a customer for the specified RFM segment.
- Spend per customer: The average total amount spent by a customer for the specified RFM segment.
- Marketing subscribers: Displays the distribution of customers who have opted-in to receive marketing from your business, highlighting their preferred communication channels for the specified RFM segment.
🎓 Key insights:
Personalize the marketing communication channel and message depending on the RFM segment you're looking to focus your efforts. For example:
|
|
Insight |
Action |
|
New segment |
The 'New' segment has a higher number of customers who have opted in to SMS, indicating that this channel may be an effective way to connect with these new customers and foster stronger relationships. |
To engage these new customers, consider implementing a "thank you" automation for first-time buyers, sent via SMS. This could include a personalized thank-you message, an exclusive offer, or a notification on how many loyalty points they earned. This approach can help solidify their loyalty early and encourage repeat purchases, while leveraging SMS as an effective communication channel for building customer rapport. |
|
Best & Loyal segment Comparison |
The 'Loyal' segment has an average order value per customer of $150, which is significantly lower than the 'Best' segment’s average order value per customer of $500. This suggests that while these customers are frequent and recent buyers, there is an opportunity to increase their spending per order. |
To encourage higher spend from your 'Loyal' customers, consider offering personalized incentives such as exclusive rewards with a minimum spend, or limited-time promotions that encourage upselling or cross-selling to drive higher order value per customer within this segment. |
Customer timeline
The daily activity timeline provides a feed of any loyalty actions completed by your customers. You can track new customer sign-ups, as well as see who is earning and spending their loyalty points. This feature helps you stay updated on customer engagement and provides valuable insights into how your loyalty program is performing.
🆕 Change: Back by popular demand, previously your loyalty activity feed was available on your home page – this was greatly missed, and is now back!
Simply click See timeline for your daily feed to display.

Timeline loyalty activities include:
- All earn options,
- e.g. [Customer name] created an account [time]
- Points manually adjusted
- Referred a friend
- Product review
- Birthday celebration
- All orders, e.g. [Customer name] made a purchase, earning [##] points [time]
- All reward actions, e.g. [Customer name] claimed reward: [reward title] [time]
🔮 Want to see more? If you'd like additional activities added to this timeline, please reach out to our support team to let us know!
FAQs
Feedback
We’d love to hear your feedback on this Customer dashboard! Let us know what’s helpful, what improvements or additional metrics you'd like to see, and if anything is unclear or needs further explanation. Our goal is to create the ultimate dashboard that provides you with clear insights and actionable data to support your business.
Simply send us a message through the chat icon or send an email to support@marsello.com.
Common questions
Q: Can I filter the RFM segments by site(s) and timeframe?
A: RFM Segmentation is an analysis that is across all customers, all time. The ability to see movements overtime is currently a feature request, if this interests you, please reach out to our support team to let us know!
Q. What is the start date for the 'All time' timeframe?
A. If you select, 'All time' for the reporting period, this begins from the date your Marsello account was created.
Q. Can I see my historical data in the Business and Loyalty metrics?
A. Currently the Business and Loyalty metrics data displays from the date your Marsello account was created forward. Historical data is currently a feature request, if this interests you, please reach out to our support team to let us know!
Q. Can I download/export my Customer dashboard?
A. If you want to capture a snapshot of the data, we suggest downloading GoFullPage - Full Page Screen Capture from the Google Chrome add-on store or equivalent. The ability to export this page is currently a feature request, if this interests you, please reach out to our support team to let us know!
Q. Does the 'site(s)' filter apply to the location where transactions occurred (i.e., only purchases made at the selected site(s))? Or does it apply to customers associated with the selected site, counting their past purchases from any location?
A. The 'site(s)' filter checks whether those customers made a purchase at the specified site within the selected timeframe.
For returning customers metrics: The 'site(s)' filter first identifies customers who have made at least two lifetime purchases with the business. Then, it checks whether those customers made a purchase at the specified site within the selected timeframe.
Q. Does the Returning customers rate on the dashboard use historic data from before integrations were connected?
A. No. The Returning customers rate only uses data collected after your integrations were connected. Any sales or customer activity before that won’t be included in this metric.
Brands also searched for: ominxhanne, omin, omnichannel, omni